


07 Jul Deburring Cost Calculation: Manual vs Automated
Deburring cost calculation is one of the most practically important analyses a production engineer or plant manager can perform when evaluating whether to continue with manual deburring or invest in an automated finishing process. Yet in many manufacturing environments, the full cost of deburring is underestimated because indirect costs such as operator fatigue, inconsistent quality, scrap rate, and rework hours are rarely captured in the initial budget. This article provides a structured engineering approach to comparing total deburring costs across manual and automated methods, with guidance on the key variables that drive the difference.
In This Article
Why Deburring Cost Is Often Underestimated
Manual deburring is perceived as low-cost because it requires no machine investment. However, when labor hours are calculated across a full production year, the cost accumulates quickly. For a production environment running two shifts with four or five deburring operators, annual labor cost alone can reach levels that justify a capital investment in automated finishing equipment within one to three years, depending on part volume and complexity.
Beyond direct labor, manual deburring introduces variability. Edge condition, surface texture, and burr removal completeness depend on individual operator skill and attention. When a part reaches assembly or inspection with an incomplete or inconsistent edge, the cost of rework, rejection, or downstream failure must also be attributed to the deburring stage. These costs are rarely factored into a simple labor-per-part estimate.
Cost Variables in Manual Deburring
A complete deburring cost calculation for manual operations must account for the following variables:
- Operator hourly wage including social charges and benefits
- Consumable cost per part: abrasive files, rotary tools, brushes, cutting discs
- Cycle time per part: average deburring time measured across operators and part geometries
- Scrap and rework rate: percentage of parts requiring re-inspection or re-processing
- Supervision and quality inspection time
- Occupational health costs: ergonomic risk, hand-arm vibration exposure, personal protective equipment
A simplified manual cost per part can be estimated as follows. If operator cost including benefits is 25 EUR per hour, average cycle time is 4 minutes per part, consumable cost is 0.05 EUR per part, and scrap rate adds 0.10 EUR equivalent per part in rework, the total cost per part approaches approximately 1.82 EUR. At a production volume of 50,000 parts per year, annual deburring cost reaches approximately 91,000 EUR. These are illustrative values only. Actual costs depend on specific labor rates, part geometry, burr characteristics, and site conditions.
Cost Variables in Automated Deburring
Automated deburring using mass finishing equipment such as vibratory or centrifugal disc machines introduces a different cost structure. Capital investment is a one-time or amortized cost, while operating costs become more predictable and repeatable over time.
The cost variables for automated finishing are:
- Machine purchase cost amortized over useful life, typically 8 to 12 years for industrial equipment
- Media cost: ceramic or plastic finishing media consumption rate per tonne of parts processed
- Compound cost: deburring and degreasing liquid consumption per batch or per hour
- Water and energy consumption per shift
- Operator time for loading, unloading, machine monitoring, and media inspection
- Maintenance cost: wear parts, seals, motor inspection, bowl liners
- Washing and drying system operating cost if integrated into the line
- Wastewater treatment cost if applicable
For a vibratory finishing machine processing 50,000 parts per year in batch cycles, total automated cost per part is typically much lower than manual processing at equivalent volumes, particularly when labor is the dominant cost driver. The breakeven point depends on production volume, part complexity, and local labor rates.
Deburring Cost Calculation: Structured Comparison
The following table provides a structured deburring cost calculation comparison between manual and automated approaches. Values shown are illustrative industrial estimates and must be validated for each specific application.
| Cost Element | Manual Deburring | Automated Vibratory Finishing |
|---|---|---|
| Labor cost per part | High — direct operator time per piece | Low — one operator monitors multiple machines |
| Consumable cost per part | Low to medium — hand tools, abrasives | Low — media wear distributed across many cycles |
| Machine investment | None or minimal | Moderate to high — amortized over 8 to 12 years |
| Process repeatability | Variable — operator-dependent | High — controlled cycle time and parameters |
| Scrap and rework cost | Higher risk due to inconsistency | Lower when process is validated |
| Output rate | Limited by operator speed | Scalable by batch size and cycle time |
| Quality audit cost | Higher — 100% or frequent sampling needed | Lower — consistent output reduces inspection frequency |
How Machine Type Affects Automated Deburring Cost
Not all automated finishing machines have the same cost structure. The machine type selected has a direct effect on cycle time, energy consumption, media wear rate, and throughput capacity.
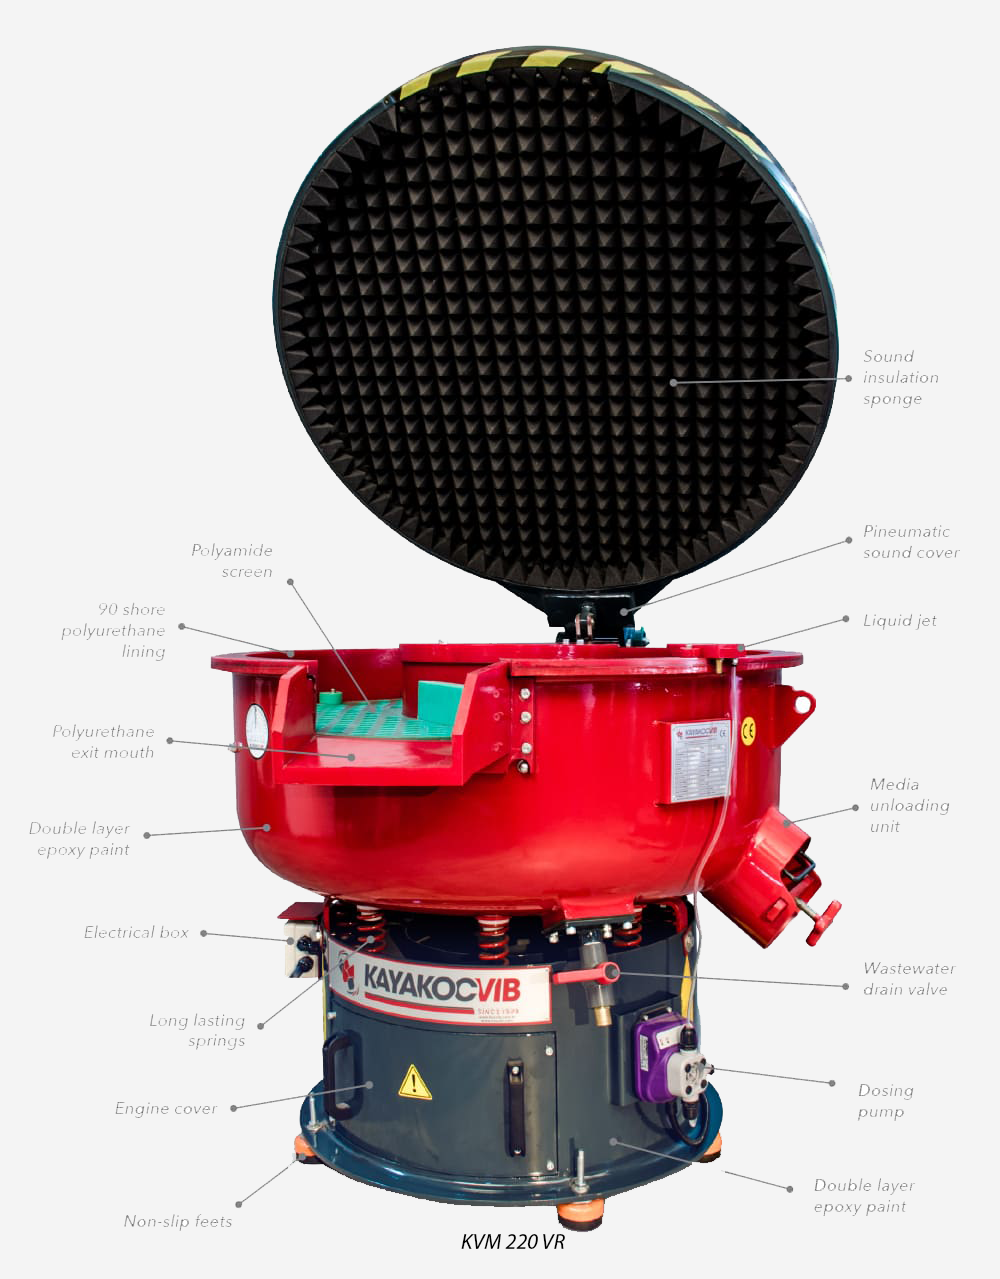
Circular vibratory finishing machines, such as the KAYAKOCVIB KVM series, are widely used for medium to high volume production of small and medium parts including CNC machined components, fasteners, stamped parts, and die castings. These machines offer continuous or batch operation and relatively low energy consumption per kilogram of parts processed. Media wear and compound consumption are moderate and predictable.
Centrifugal disc finishing machines, such as the KAYAKOCVIB KSM series, operate at significantly higher process intensity than vibratory machines. Cycle times are shorter, often 5 to 20 minutes compared to 30 to 90 minutes for vibratory finishing. For precision parts where short cycle time and consistent edge quality are critical, the KSM can reduce per-part cost even when machine investment is higher, because throughput per shift increases substantially.
Trough vibratory finishing machines, such as the KAYAKOCVIB TVM series, are suitable for longer or bulkier parts that do not process efficiently in circular machines. While investment cost is similar, trough machines may require lower media volumes per batch for certain part geometries, which affects ongoing media cost.
Media and Compound Selection Impact on Operating Cost
Media selection is a significant lever in automated deburring cost control. The choice between ceramic and plastic media affects both cycle time and media consumption rate.
For steel and stainless steel parts, ceramic media is generally preferred because it provides the cutting intensity required to remove harder metal burrs efficiently. Ceramic media has higher wear resistance than plastic in aggressive cutting conditions, which reduces replacement frequency. A suitable process chemical for steel deburring is a neutral to alkaline deburring and polishing liquid such as KAYAKOCVIB 943, combined with 028-S degreasing liquid where oil or coolant contamination is present on incoming parts.
For aluminum and mixed metal parts, plastic media is generally preferred because it is less aggressive and avoids surface damage on softer alloys. Media wear rate for plastic media is higher than ceramic in intensive applications, so consumption cost must be calculated separately. For aluminum deburring, a polishing liquid such as KAYAKOCVIB 085 combined with 028-S degreasing liquid is a common process approach.
Media volume in the machine bowl affects both energy consumption and deburring effectiveness. An under-filled bowl reduces finishing intensity and extends cycle time, which increases cost per part. An over-filled bowl can reduce part movement and also compromise result consistency. Correct media fill ratio must be established during process validation and maintained through regular media top-up practice.
ROI Calculation Framework for Automated Deburring
A practical deburring cost calculation for ROI estimation can follow this structured approach:
- Calculate current annual manual deburring cost: labor hours per year multiplied by fully loaded hourly rate, plus consumable cost, plus estimated scrap and rework cost.
- Estimate annual automated deburring cost: machine amortization per year, plus media and compound cost per year, plus reduced operator labor cost per year, plus maintenance cost, plus energy and water cost.
- Calculate annual cost savings: current manual cost minus projected automated cost.
- Estimate payback period: total machine investment divided by annual cost savings.
- Add quality cost improvement estimate if scrap rate reduction can be quantified.
In many industrial manufacturing environments where production volume exceeds 20,000 to 50,000 parts per year and manual deburring is the current method, the payback period for an automated vibratory finishing machine is commonly in the range of 12 to 36 months. This is an indicative range and depends on local labor rates, part complexity, machine size, and current scrap rates. Actual ROI must be calculated using site-specific data.
Quality Cost as a Hidden Driver in the Calculation
Quality cost is one of the most undervalued inputs in a deburring cost calculation. Manual deburring generates inconsistent edge conditions across operators and across production shifts. When parts with incomplete burr removal reach downstream processes such as coating, welding, assembly, or functional testing, failure rates increase. The cost of a coating defect caused by a residual burr is typically far higher than the cost of automated deburring per part.
Automated vibratory or centrifugal finishing eliminates operator variability and produces consistent edge condition across the entire batch. Once the process is validated, the edge radius, surface texture, and cleanliness of the finished part remain within a predictable range. This consistency reduces the frequency and depth of quality inspection required, which further reduces indirect cost.
When Manual Deburring Remains Justified
Automated deburring is not always the appropriate choice. Manual deburring remains justified in the following situations:
- Very low production volumes where machine amortization cost per part is too high
- Parts with complex internal features, deep blind holes, or geometries that cannot be reached by mass finishing media
- Single-piece or prototype production where batch processing is impractical
- Applications where automated finishing would remove material beyond the tolerance permitted
- Parts with extremely delicate features or thin sections where vibratory intensity would cause distortion or damage
In these cases, targeted manual deburring using rotary tools, brushes, or hand files remains the most practical approach. The goal of the deburring cost calculation is not always to eliminate manual methods, but to identify which parts and volumes genuinely benefit from automation and which do not.
Frequently Asked Questions
What is the most important variable in a deburring cost calculation?
Labor cost is typically the dominant variable in manual deburring environments. For automated deburring, the key variables are machine amortization, media consumption, cycle time, and throughput. Quality cost and scrap rate are often underweighted but can significantly change the result of the calculation.
At what production volume does automated deburring typically become cost-effective?
There is no universal threshold, as it depends on labor rates, part complexity, and machine size. In many CNC machining and stamping environments, automated vibratory finishing begins to show cost advantages over manual deburring at annual volumes above approximately 20,000 to 50,000 parts. Actual breakeven volume must be calculated per application.
How does media wear affect ongoing deburring cost in automated systems?
Media wear is a continuous operating cost in automated finishing. Ceramic media wears more slowly than plastic media in aggressive conditions and generally produces lower media cost per tonne of parts processed in steel deburring applications. Media wear rate depends on process intensity, water chemistry, compound pH, and part material. Regular media level monitoring and top-up practice prevents unnecessary cycle time extension caused by under-filled bowls.
Can automated vibratory finishing replace manual deburring for all part types?
No. Automated mass finishing is highly effective for parts with accessible burr edges, moderate geometry complexity, and production volumes large enough to justify batch processing. Parts with very tight internal features, blind holes, or extremely delicate geometry may still require manual intervention or alternative processes such as drag finishing for precision edge work.
Related Process Equipment
Conclusion
A complete deburring cost calculation must go beyond simple labor and tool cost estimates. It must include operator productivity, quality failure cost, scrap and rework rates, media and compound consumption, machine amortization, and downstream process impact. When these elements are assessed together, automated deburring solutions using vibratory or centrifugal disc finishing machines consistently demonstrate lower total cost per part at medium to high production volumes compared to purely manual methods. The decision should be supported by site-specific data, and where possible, a sample finishing trial should be conducted to validate cycle time, media selection, and surface quality outcomes before committing to machine investment.
Sorry, the comment form is closed at this time.